
| 일 | 월 | 화 | 수 | 목 | 금 | 토 |
|---|---|---|---|---|---|---|
| 1 | 2 | 3 | ||||
| 4 | 5 | 6 | 7 | 8 | 9 | 10 |
| 11 | 12 | 13 | 14 | 15 | 16 | 17 |
| 18 | 19 | 20 | 21 | 22 | 23 | 24 |
| 25 | 26 | 27 | 28 | 29 | 30 | 31 |
- 영화추천
- 통영여행
- 파이썬
- ubuntu자바설치
- 성신여대맛집
- 뚝섬역맛집
- npm
- 스페인여행
- 한성대맛집
- 돈암동맛집
- 통영
- ELK
- springboot
- 한남동맛집
- 통영에어비앤비
- 서울숲누룽지통닭구이
- 방이편백육분삼십성신여대
- gradle
- 퇴사후공무원
- 성북구맛집
- 국가직
- react
- JavaScript
- 성신여대편백집
- 꼴뚜기회
- tomcat7
- 방이편백육분삼십
- 자바스크립트에러처리
- 공무원
- 통영예쁜카페
- Today
- Total
코린이의 기록
[ELK] Integrate Filebeat + Kafka + Logstash + Elasticsearch + Kibana 본문
* 해당 포스팅은 beat + kafka + logstash + elasticsearch + kibana에 대한 integrate 이해를 위해 작성한 것으로 tutorial 할 수 있는 예제가 아니므로 step by step으로 test를 해보고 싶으시다면 아래 링크를 참고해주세요.
목차
Filebeat, Kafka, Logstash, Elasticsearch, kibana는 각각 다른 위치에 있는 수백만의 서버의 데이터를 실시간으로 분석하는데 사용된다. 주로 로그 수준 분석, 문제 추적, 데이터의 이상 징후 및 특정 발생 이벤트 알람 등에 도움이 된다. 이러한 기술을 사용하여 확장 가능한 아키텍처를 제공하여 시스템을 향상시키고 서로 개별적으로 분리시킬 수 있다.
Why these Technology?
Filebeat: 로그 수집가
-
Lightweight agent for shipping logs. (경량화 된 에이전트)
-
Forward and centralize files and logs.
-
Robust (Not miss a single beat) 견고함 (단 하나의 beat도 놓치지 않음)
Kafka: 메시지 브로커
-
Open source distributed, Steam Processing, Message Broker platform.
-
process stream data or transaction logs on real time.
-
fault-tolerant, high throughput, low latency platform for dealing real time data feeds.
Logstash: 데이터 분석가
-
Open source, server-side data processing pipeline that accept data from a different sources simultaneously.
-
Parse, Format, Transform data and send to different output sources. (데이터를 파싱하고 포맷화 및 변화시켜 다른 출력소스로 보낸다.)
Elasticsearch: 데이터 검색
-
Elasticsearch is open source, distributed cross-platform.
-
Built on top of Lucene which provide full text search and provide NRT(Near real Time) search results.
-
Support RESTFUL search by Elasticsearch REST
Kibana: 데이터 시각화
-
Open source
-
Provide window to view Elasticsearch data in form different charts and dashboard. 검색된 데이터를 차트 및 대시보드를 통해 시각화 해줌.
-
Provide way searches and operation of data easily with respect to time interval. 시간 간격에 따른 데이터 검색 및 운용에 용이하다.
-
Easily Imported by any web application by embedded dashboards.
Data flow
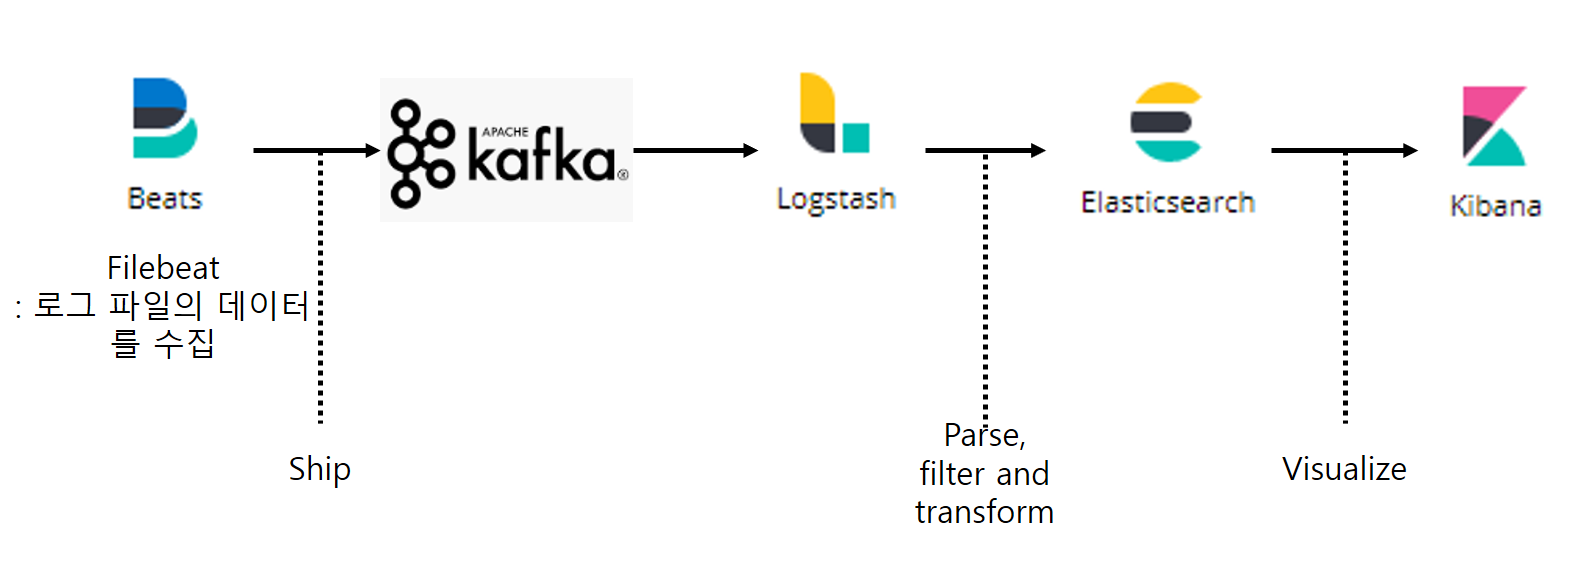
filebeat는 application이 deploy된 서버 어디든 설치될 수 있다. 그리고 filebeat는 이 서버로 부터 최신 로그의 변화를 읽고 Kafka에 전달하는(ship/producer) 역할을 한다. Logstash는 kafka topic으로 부터 로그를 subscribe하며 parsing하고 formatting 하여 Elasticsearch로 전달한다. 그리고 elasticsearch에서 전달되는 data를 visualize 해주는것이 kibana이다. kibana는 분석 데이터를 chart, dashboard로 나타내 준다.
* 참고로 beat는 현재 기준 제품 7개가 있다.
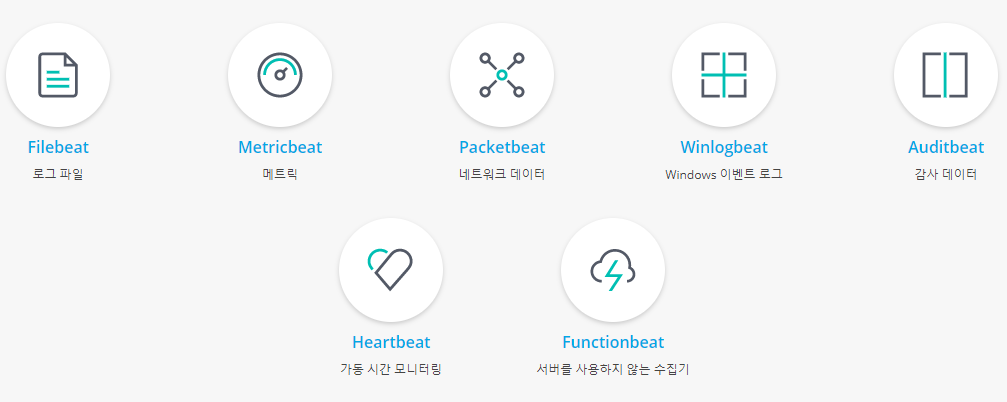
l Filebeat: 로그 파일의 데이터를 수집
l Metricbeat: 서버의 CPU, 메모리 사용률 수집이 가능하고, DBMS나 Docker등의 서비스의 메트릭도 수집
l Packetbeat: 네트워크 패켓 데이터를 수집. 프로토콜 및 서비스 별로 수집이 가능
l Winlogbeat: Windows 이벤트 로그 수집
l Heartbeat: Uptime Monitoring
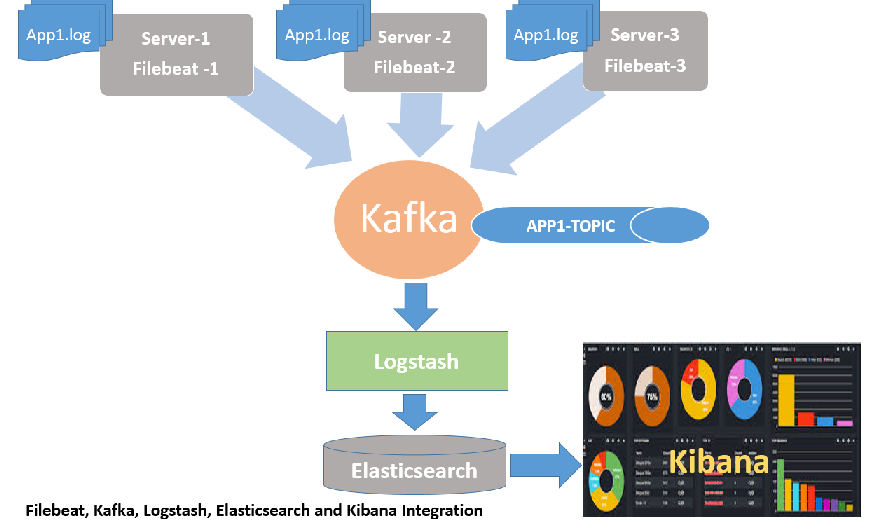
Data Architecture
my application이 세개의 serve에 배포되어 있고, 각 서버에 App1.log라는 이름의 로그 파일을 가지고 있다. 목표는 실시간으로 이러한 데이터를 읽고 분석하는 것이다.
Steps to Installation, Configuration and Start
먼저 Kafka를 설치하고 Elasticsearch를 개별적으로 실행한다. 나머지 도구는 데이터 흐름을 테스트하기 위해 시퀀스를 설치하고 실행한다. 처음에는 동일한 시스템에 모두 설치하고 아래 단계에 따라 샘플 데이터로 테스트하고이 마지막 단계에 서버에 따라 변경해야하는 사항에 대해 설명한다.
-
Kafka Installation, Configuration and Start
-
Elasticsearch Installation,Configuration and Start
-
Filebeat Installation,Configuration and Start
-
Logstash Installation,Configuration and Start
-
Kibana Installation,Start and display.
Pre-Requiste
-
Java 8+
-
Kafka/Zookeeper 2.xx
-
Elasticsearch 7.xx
-
Filebeat 7.xx
-
Logstash 7.xx
-
Kibana 7.xx
아래 링크에서 최신버전을 받는것이 좋음!
Sample log data
|
2013-02-28 09:57:56,662 WARN CreateSomethingActivationKey - WhateverException for User 49-123-345678 {{rid,US8cFAp5eZgAABwUItEAAAAI_dev01_443}{realsid,60A9772A136B9912B6FF0C3627A47090.dev1-a}} 2013-02-28 09:57:56,663 INFO LMLogger - ERR1700 - u:null failures: 0 - Technical error {{rid,US8cFAp5eZgAABwUItEAAAAI_dev01_443}{realsid,60A9772A136B9912B6FF0C3627A47090.dev1-a}} 2013-02-28 09:57:56,668 ERROR SomeCallLogger - ESS10005 Cpc portalservices: Exception caught while writing log messege to MEA Call: {} java.sql.SQLSyntaxErrorException: ORA-00942: table or view does not exist
at oracle.jdbc.driver.T4CTTIoer.processError(T4CTTIoer.java:445) at oracle.jdbc.driver.T4CTTIoer.processError(T4CTTIoer.java:396) 2013-02-28 10:04:35,723 INFO EntryFilter - Fresh on request /portalservices/foobarwhatever {{rid,US8dogp5eZgAABwXPGEAAAAL_dev01_443}{realsid,56BA2AD41D9BB28AFCEEEFF927EE61C2.dev1-a}} |
Kafka
- 분산된 오픈 소스, Steam Processing, Message Broker 플랫폼
- 스트림 데이터 또는 트랜잭션 로그를 실시간으로 처리합니다.
- 실시간 데이터 피드 처리를위한 내결함성, 높은 처리량, 낮은 대기 시간의 플랫폼
Installation, Configuration and start
Kafka의 대부분의 동작은 Zookeeper와 연계되어 있기 때문에 Zookeeper 없이는 Kafka를 구동할 수 없다. 이 때문에 Kafka 패키지를 받으면 패키지 안에 Zookeeper도 함께 들어있다. 물론 Kafka 패키지 안에 들어있는 Zookeeper 대신 Zookeeper 최신 버전 패키지를 받아서 사용해도 되지만, 패키지 안에 들어있는 Zookeeper는 해당 Kafka 버전과 잘 동작하는 것이 검증된 버전이므로 개인적으로는 Kafka 패키지 안에 들어있는 Zookeeper의 사용을 권장한다.
출처 : Apache kafka 구축하기
여기서 kafka는 비동기 처리를위한 메시징 큐의 한종류라고 할 수 있는데 그렇다면 zookeeper는 무엇인가? zookeeper는 kafka의 노드를 관리해주고 topic의 offset 정보등을 저장하기 위해 필요하다.
1. Installation
Download Link : https://kafka.apache.org/downloads

$ wget http://apache.mirror.cdnetworks.com/kafka/2.6.0/kafka_2.13-2.6.0.tgz
$ tar -xzvf kafka_2.13-2.6.0.tgz
2. Configuration
Zookeeper 설정 : config/zookeeper.properties
clientPort=2181clientPort는 클라이언트가 연결할 포트이다. zookeeper.properties에서 기본 포트는 2181로, server.properties 아래와 같이 업데이트해야합니다.
config 디렉토리의 server.properties 구성 파일에서 다음과 같이 변경한다.
broker.id=0
listeners=PLAINTEXT://:9092
log.dir=/tmp/kafka-logs
zookeeper.connect=localhost:2181
broker.id : Zookeeper가 Kafka Cluster에 있는 브로커를 인식하기위한 대표 unique ID. Kafka Cluster가 복수의 server를 가지고 있을 경우 이 broker ID는 서버 순으로 증가된다.
listeners : 각각의 broker가 다른 port로 실행된다. default port는 9092이며 변경할 수 있다.
log.dir: Kafka가 stream record를 저장할 로그 path. default로 /tmp/kafka-log이다.
3. Run
$ screen -d -m bin/zookeeper-server-start.sh config/zookeeper.properties
$ screen -d -m bin/kafka-server-start.sh config/server.properties
Kafka가 성공적으로 실행되고 있는지 확인해보려면
$ ps -ef|grep kafka
Kafka 자세한 설명 참고하기
Elasticsearch
- 분산형RESTful검색 및 분석 엔진
- 데이터를 중심부에 저장하여 예상되는 항목을 검색하고 예상치 못한 항목을 밝혀낼 수 있다.
- 정형, 비정형, 위치정보, 메트릭 등 원하는 방법으로 다양한 유형의 검색을 수행하고 결합할 수 이다.
- 표준 RESTful API와 JSON을 사용
Installation, Configuration and start
1. Installation
Download Link : https://www.elastic.co/downloads/elasticsearch
$ wget https://artifacts.elastic.co/downloads/elasticsearch/elasticsearch-7.9.0-linux-x86_64.tar.gz
$ tar -xzvf elasticsearch-7.9.0-linux-x86_64.tar.gz
2. Configuration
Elasticsearch 설정 : config/elasticsearch.yml
cluster.name: FACING-ISSUE-IN-IT
node.name: TEST-NODE-1
network.host: 0.0.0.0
http.port: 9200
3. Run
$ screen -d -m /bin/elasticsearchelasticsearch가 성공적으로 시작되었는지 확인하려면 브라우저에서 아래 URL을 사용하여 클러스터 상태를 알 수 있다.
http://localhost:9200/_cluster/health?pretty
혹은 network.host를 별도로 설정했다면 elasticserverIp에 해당 Ip를 이용하여 클러스터 상태를 확인한다.
http://elasticseverIp:9200/_cluster/health?pretty
또는 curl명령어를 통해 확인할 수 있다.
curl -XGET 127.0.0.1:9200{
"name" : "sy",
"cluster_name" : "elasticsearch",
"cluster_uuid" : "ttVzNhDUQueQsZcGnQ0O5A",
"version" : {
"number" : "7.0.1",
"build_flavor" : "default",
"build_type" : "rpm",
"build_hash" : "e4efcb5",
"build_date" : "2019-04-29T12:56:03.145736Z",
"build_snapshot" : false,
"lucene_version" : "8.0.0",
"minimum_wire_compatibility_version" : "6.7.0",
"minimum_index_compatibility_version" : "6.0.0-beta1"
},
"tagline" : "You Know, for Search"
}$ curl -XGET http://localhost:9200/_cluster/health?pretty{
"cluster_name" : "elasticsearch",
"status" : "green",
"timed_out" : false,
"number_of_nodes" : 1,
"number_of_data_nodes" : 1,
"active_primary_shards" : 0,
"active_shards" : 0,
"relocating_shards" : 0,
"initializing_shards" : 0,
"unassigned_shards" : 0,
"delayed_unassigned_shards" : 0,
"number_of_pending_tasks" : 0,
"number_of_in_flight_fetch" : 0,
"task_max_waiting_in_queue_millis" : 0,
"active_shards_percent_as_number" : 100.0
}
혹시 위 설정에도 불구하고 curl: (7) Failed connect to localhost:9200; Connection refused 와 같은 에러가 발생하면 아래 command로 elasticsearch를 실행 시킨다.
$ sudo systemctl enable elasticsearch.service
$ sudo service elasticsearch start
Filebeat
Filebeat(경량 로그 수집기)는 로그를 생성하는 서버나 가상 시스템, 컨테이너가 수십, 수백, 수천 개에 이르는 경우 SSH 터미널의 사용이 불가능합니다. Filebeat는 이런 상황에서 로그와 파일을 경량화된 방식으로 전달하고 중앙 집중화하여 작업을 보다 간편하게 만들어 주는 역할을 합니다.
Installation, Configuration and start
Example: Set up Filebeat modules to work with Kafka and Logstash :
https://www.elastic.co/guide/en/logstash/current/use-filebeat-modules-kafka.html
1. Installation
Download Link : https://www.elastic.co/downloads/beats/filebeat
$ wget https://artifacts.elastic.co/downloads/beats/filebeat/filebeat-7.9.0-linux-x86_64.tar.gz
$ tar -zxvf filebeat-7.9.0-linux-x86_64.tar.gz
2. Configuration
Filebeat 설정 : config/filebeat.yml
log file path를 변경한다.
paths:
	- /opt/app/facingissuesonit/App1.log
아래 default 값들은 주석 처리한다.
#output.elasticsearch:
#hosts: ["localhost:9200"]
날짜로 시작하지 않는 모든 스택 트레이스 라인이 단일 라인으로 간주 될 수 있도록 아래와 같이 다중 라인 옵션을 구성한다.
multiline.pattern: ^\d
multiline.negate: true
multiline.match: after
내부 Kafka 출력 섹션은 이러한 속성 호스트 및 topic을 업데이트한다. 동일한 시스템에 Kafka가 있으면 localhost를 사용하고 그렇지 않으면 kafka 시스템의 IP로 업데이트한다.
output.kafka:
 hosts: ["localhost:9092"]
 topic: APP-1-TOPIC
3. run
$ ./filebeat -e -c filebeat.yml -d "publish"yoonsoyeon@sy:~/workspace/ELK/filebeat-7.9.0-linux-x86_64$ ./filebeat -e -c filebeat.yml -d "publish"
2020-08-25T16:23:55.920+0900 INFO instance/beat.go:640 Home path: [/home/yoonsoyeon/workspace/ELK/filebeat-7.9.0-linux-x86_64] Config path: [/home/yoonsoyeon/workspace/ELK/filebeat-7.9.0-linux-x86_64] Data path: [/home/yoonsoyeon/workspace/ELK/filebeat-7.9.0-linux-x86_64/data] Logs path: [/home/yoonsoyeon/workspace/ELK/filebeat-7.9.0-linux-x86_64/logs]
2020-08-25T16:23:55.977+0900 INFO instance/beat.go:648 Beat ID: 7243efb6-2e93-4f5b-bcc7-f1f964754391
2020-08-25T16:23:58.979+0900 INFO [add_cloud_metadata] add_cloud_metadata/add_cloud_metadata.go:89 add_cloud_metadata: hosting provider type not detected.
2020-08-25T16:23:58.980+0900 INFO [seccomp] seccomp/seccomp.go:124 Syscall filter successfully installed
2020-08-25T16:23:58.980+0900 INFO [beat] instance/beat.go:976 Beat info {"system_info": {"beat": {"path": {"config": "/home/yoonsoyeon/workspace/ELK/filebeat-7.9.0-linux-x86_64", "data": "/home/yoonsoyeon/workspace/ELK/filebeat-7.9.0-linux-x86_64/data", "home": "/home/yoonsoyeon/workspace/ELK/filebeat-7.9.0-linux-x86_64", "logs": "/home/yoonsoyeon/workspace/ELK/filebeat-7.9.0-linux-x86_64/logs"}, "type": "filebeat", "uuid": "7243efb6-2e93-4f5b-bcc7-f1f964754391"}}}
2020-08-25T16:23:58.980+0900 INFO [beat] instance/beat.go:985 Build info {"system_info": {"build": {"commit": "b2ee705fc4a59c023136c046803b56bc82a16c8d", "libbeat": "7.9.0", "time": "2020-08-11T20:11:11.000Z", "version": "7.9.0"}}}
2020-08-25T16:23:58.980+0900 INFO [beat] instance/beat.go:988 Go runtime info {"system_info": {"go": {"os":"linux","arch":"amd64","max_procs":8,"version":"go1.14.4"}}}
2020-08-25T16:23:58.981+0900 INFO [beat] instance/beat.go:992 Host info {"system_info": {"host": {"architecture":"x86_64","boot_time":"2020-08-06T10:42:32+09:00","containerized":false,"name":"sy","ip":["127.0.0.1/8","::1/128","10.40.0.17/23","fe80::1a03:73ff:fead:b7c0/64","172.17.0.1/16"],"kernel_version":"4.4.0-133-generic","mac":["18:03:73:ad:b7:c0","02:42:e9:52:1c:14"],"os":{"family":"debian","platform":"ubuntu","name":"Ubuntu","version":"16.04.5 LTS (Xenial Xerus)","major":16,"minor":4,"patch":5,"codename":"xenial"},"timezone":"KST","timezone_offset_sec":32400,"id":"63a014a9a8e304f94671901456fac4ec"}}}
2020-08-25T16:23:58.982+0900 INFO [beat] instance/beat.go:1021 Process info {"system_info": {"process": {"capabilities": {"inheritable":null,"permitted":null,"effective":null,"bounding":["chown","dac_override","dac_read_search","fowner","fsetid","kill","setgid","setuid","setpcap","linux_immutable","net_bind_service","net_broadcast","net_admin","net_raw","ipc_lock","ipc_owner","sys_module","sys_rawio","sys_chroot","sys_ptrace","sys_pacct","sys_admin","sys_boot","sys_nice","sys_resource","sys_time","sys_tty_config","mknod","lease","audit_write","audit_control","setfcap","mac_override","mac_admin","syslog","wake_alarm","block_suspend","audit_read"],"ambient":null}, "cwd": "/home/yoonsoyeon/workspace/ELK/filebeat-7.9.0-linux-x86_64", "exe": "/home/yoonsoyeon/workspace/ELK/filebeat-7.9.0-linux-x86_64/filebeat", "name": "filebeat", "pid": 344, "ppid": 32698, "seccomp": {"mode":"filter"}, "start_time": "2020-08-25T16:23:55.130+0900"}}}
2020-08-25T16:23:58.982+0900 INFO instance/beat.go:299 Setup Beat: filebeat; Version: 7.9.0
2020-08-25T16:23:58.983+0900 INFO [publisher] pipeline/module.go:113 Beat name: sy
2020-08-25T16:23:58.984+0900 WARN beater/filebeat.go:178 Filebeat is unable to load the Ingest Node pipelines for the configured modules because the Elasticsearch output is not configured/enabled. If you have already loaded the Ingest Node pipelines or are using Logstash pipelines, you can ignore this warning.
2020-08-25T16:23:58.984+0900 INFO instance/beat.go:450 filebeat start running.
2020-08-25T16:23:58.984+0900 INFO [monitoring] log/log.go:118 Starting metrics logging every 30s
2020-08-25T16:23:59.050+0900 INFO memlog/store.go:119 Loading data file of '/home/yoonsoyeon/workspace/ELK/filebeat-7.9.0-linux-x86_64/data/registry/filebeat' succeeded. Active transaction id=0
2020-08-25T16:23:59.050+0900 INFO memlog/store.go:124 Finished loading transaction log file for '/home/yoonsoyeon/workspace/ELK/filebeat-7.9.0-linux-x86_64/data/registry/filebeat'. Active transaction id=0
2020-08-25T16:23:59.050+0900 WARN beater/filebeat.go:381 Filebeat is unable to load the Ingest Node pipelines for the configured modules because the Elasticsearch output is not configured/enabled. If you have already loaded the Ingest Node pipelines or are using Logstash pipelines, you can ignore this warning.
2020-08-25T16:23:59.051+0900 INFO [registrar] registrar/registrar.go:108 States Loaded from registrar: 0
2020-08-25T16:23:59.051+0900 INFO [crawler] beater/crawler.go:71 Loading Inputs: 1
2020-08-25T16:23:59.051+0900 INFO [crawler] beater/crawler.go:108 Loading and starting Inputs completed. Enabled inputs: 0
2020-08-25T16:23:59.051+0900 INFO cfgfile/reload.go:164 Config reloader started
2020-08-25T16:23:59.051+0900 INFO cfgfile/reload.go:224 Loading of config files completed.
* 참고로 아래는 Kafka output configuration임 (output은 Elasticsearch, Logstash 등등이 될수도 있음)
kafka output guide : https://www.elastic.co/guide/en/beats/filebeat/master/kafka-output.html
* 빨간색 글씨는 알아서 수정
|
######################## Filebeat Configuration ############################
# This file is a full configuration example documenting all non-deprecated # options in comments. For a shorter configuration example, that contains only # the most common options, please see filebeat.yml in the same directory. # # You can find the full configuration reference here: # https://www.elastic.co/guide/en/beats/filebeat/index.html
#========================== Modules configuration ============================ #filebeat.modules:
#=========================== Filebeat prospectors =============================
# List of prospectors to fetch data. filebeat: prospectors: - input_type: log paths: - [log path] scan_frequency: 1s close_inactive: 2h backoff: 1s max_backoff: 1s #----------------------------- kafka output --------------------------------- output.kafka: # initial brokers for reading cluster metadata hosts: ["[Kafka IP]:9092"] codec.format: string: '%{[message]}' # message topic selection + partitioning topic: '[Yours Topic]' partition.round_robin: reachable_only: false
required_acks: 1 compression: gzip max_message_bytes: 1000000
fields_under_root: true fields: type: filebeat
logging.level: info logging.to_files: true logging.files: # Configure the path where the logs are written. The default is the logs directory # under the home path (the binary location). path: [Your filebeat path]
# The name of the files where the logs are written to. name: filebeat
# Configure log file size limit. If limit is reached, log file will be # automatically rotated rotateeverybytes: 50485760 # = 10MB
# Number of rotated log files to keep. Oldest files will be deleted first. keepfiles: 7 |
- input (filebeat)
prospectors : prospectors는 Filebeat의 input을 정의하는 것으로 '-'를 이용하여 여러개의 input을 정의할 수 있다.
path : 로그 파일 위치 (ex. /var/log/www/oma_tracking/tracking.log)
filebeat는 로그 파일 위치에 있는 파일을 지켜보면서 파일 업데이트를 감지(beat)하여 output인 kafka로 전달한다.
-> It will read from configured prospector for file [log path] continiously and publish log line events to Kafka . It will also create topic as [Yours Topic] in Kafka if not exist.
- output (kafka)
output.xxx는 출력을 정의한다.
hosts : hosts는 kafka 클러스터 노드들을 배열로 나열한다.
topic : 여기서 filebeat가 producer가 되고, kafka가 publish할 topic을 설정한다.
참고로 topic은 DB의 table정도의 개념으로 생각하면 될듯.
3. Start
$ sudo systemctl enable filebeat
$ sudo systemctl start filebeatLog
Logstash
- 다른 source의 데이터를 동시에 수용하는 오픈 소스, 서버 측 data processing pipeline .
- 구문 분석, 형식 지정, 데이터 변환 및 다른 output source로 전달
Installation, Configuration and Start
1. Installation
Logstash설치는 아래 따로 포스팅해두었으니 아래 포스팅으로 대체한다.
2. Configuration
Logstash configuration 폴더(ex. /etc/logstash/)에 가보면 logstash-sample.conf 가 있다. 이걸 수정해도 좋고 copy해서 수정해도 좋다.
logstash-sample.conf
| # Sample Logstash configuration for creating a simple # Beats -> Logstash -> Elasticsearch pipeline. input { beats { port => 5044 } } output { elasticsearch { hosts => ["http://localhost:9200"] index => "%{[@metadata][beat]}-%{[@metadata][version]}-%{+YYYY.MM.dd}" #user => "elastic" #password => "changeme" } } |
my-logstash.conf
* 빨간색 글씨는 알아서 수정
| input { kafka { bootstrap_servers => "[kafka IP]:9092" topics => ["Your Topic"] consumer_threads => 2 group_id => "Your group" } } filter { json { source => "message" } kv { source => "data" field_split => "&" } urldecode { all_fields => true } translate { field => "opeType" destination => "opeType_mes" refresh_interval => 60 dictionary_path => "[config path]" override => true } translate { field => "status" destination => "status_mes" refresh_interval => 60 dictionary_path => "[config path]" override => true } mutate { remove_field => ["data", "message"] } } output { elasticsearch { hosts => ["[Elasticsearch IP]:9200"] index => "app1-logs-%{+YYYY.MM.dd}" } } |
3. Run
$ bin/logstash -f /etc/logstash/my-logstash.conf --path.data /tmp &
- -f [CONFIG_PATH] : 특정 파일 혹은 디렉토리로 부터 Logstash config를 Load한다.
- --path.data [PATH] : 해당 PATH는 쓰기 가능한 디렉토리여야한다. Logstash는 이 디렉토리를 이용하여 데이터를 저장한다. default 디렉토리는 Logstash home 아래임.
Kibana
Installation, Configuration and Start
1. Installation & Configuration & Run
kibana 설치 및 Configuration은 아래 따로 포스팅해두었으니 아래 포스팅으로 대체한다.
Reference
'ELK' 카테고리의 다른 글
| [ELK] Elasticsearch in the MAC OS (0) | 2020.08.25 |
|---|---|
| [ELK] mac에서 elasticsearch 실행 시 unsupported OS ERROR 발생시 해결 방법 (0) | 2020.08.25 |
| [Elasitcsearch] v7.0.1 Indexing / Mapping / Searching (0) | 2019.05.08 |
| [Elasticsearch] network.host 설정 bootstrap checks failed (0) | 2019.05.07 |
| [Logstash] Logstash 7.x 설치 및 다운로드 (0) | 2019.05.07 |


